In general, the tools map with monitoring features lists as below.
- Graphite - Metrics Feature, which provides graphic display for your monitoring items.
- Logstash - Logging Feature
- Nagios - Alert Feature
Since the monitoring tools as above are all open source and can be found in the internet, I won't explain the installation step. But I summarized them as blow.
By default, Graphite configured to use SQLite, however to be more robust, some people use PostgreSQL. Here are how to install and setup it.
The Graphite webapp provides a /render endpoint for generate graph and retrieving raw data. This endpoint accepts various arguments via query string parameters. These parameters are separated by an ampersand ( & ) and are supplied in the format like "&name=value". It's a very handy tools when you develop and debug the Graphite thresholds in Naghios.
#web e.g.:
http://10.xx.xx.xx/render?target=johnny.count&from=-120s&format=json #Output e.g.:[{"target": "johnny.count", "datapoints": [[null, 1443801460], [null, 1443801470], [null, 1443801480], [null, 1443801490], [null, 1443801500], [null, 1443801510], [null, 1443801520], [null, 1443801530], [null, 1443801540], [null, 1443801550], [null, 1443801560], [null, 1443801570]]}]
PS: u can see the null in every 10 s, since collectd just send one plot a time.
However statsd flushes stats to Graphite in sync with Graphite's configured write interval. To do this, it aggregates all of the data between flush intervals and created single points for each statistic to send to Graphite. It has many libraries written in different programming languages that make it trivial to build in stats tracking with service or applications.
Statsd configure relative with port and interval.
# cat /opt/statsd/localConfig.js
{
graphitePort: 2003 ,
graphiteHost: "0.0.0.0" ,
port: 8125 ,
backends: [ "./backends/graphite" ] ,
graphite: { legacyNamespace: false ,
globalPrefix: "statsd" ,
prefixCounter: "" ,
prefixTimer: "" ,
prefixGauge: "" ,
prefixSet: "" }
}

Graphite:
Install and Setup
The Graphite components is a graphic metric web application set, it includes web interface which is Apache(Apache Web Server), storage backend called "Carbon", and the database library called "Whisper".By default, Graphite configured to use SQLite, however to be more robust, some people use PostgreSQL. Here are how to install and setup it.
Install and Setup in Ubuntu 14.4
https://www.digitalocean.com/community/tutorials/how-to-install-and-use-graphite-on-an-ubuntu-14-04-serverInstall and Setup in Ubuntu 12
https://www.digitalocean.com/community/tutorials/installing-and-configuring-graphite-and-statsd-on-an-ubuntu-12-04-vpsThe Graphite webapp provides a /render endpoint for generate graph and retrieving raw data. This endpoint accepts various arguments via query string parameters. These parameters are separated by an ampersand ( & ) and are supplied in the format like "&name=value". It's a very handy tools when you develop and debug the Graphite thresholds in Naghios.
Render api
http://graphite.readthedocs.org/en/latest/render_api.html e.g. http://10.xx.xx.xx/render?target=statsd.Cluster.Drive.node1.drive32.UporDown&from=-20s&until=-10s&format=jsonCollectD
If we said Graphite is application sets to visualize data, then we need a way to feed the data to Graphite properly. ColledD and statsd are a system statistic gatherer that can collect and organize metrics about monitoring target and running services.Install and Configure collectd
https://www.digitalocean.com/community/tutorials/how-to-configure-collectd-to-gather-system-metrics-for-grdaphite-on-ubuntu-14-04Collectd testing via nc
After install and configure the collectd, you can do a quick unit test via the cli like - echo "metric_name metric_value `date +%s` | nc -q0 127.0.0.1 2003
#cli e.g.
#echo "johnny.count 4 `date +%s`" | nc -q0 10.114.192.154 2003 Then you can go back to Graphite to check via graphite render api on browser url.
#echo "johnny.count 4 `date +%s`" | nc -q0 10.114.192.154 2003 Then you can go back to Graphite to check via graphite render api on browser url.
#web e.g.:
http://10.xx.xx.xx/render?target=johnny.count&from=-120s&format=json #Output e.g.:[{"target": "johnny.count", "datapoints": [[null, 1443801460], [null, 1443801470], [null, 1443801480], [null, 1443801490], [null, 1443801500], [null, 1443801510], [null, 1443801520], [null, 1443801530], [null, 1443801540], [null, 1443801550], [null, 1443801560], [null, 1443801570]]}]
PS: u can see the null in every 10 s, since collectd just send one plot a time.
StatsD
Like we mentioned before, Graphite is a graphing library that allows you to visualize different kinds of data in a flexible and powerful way. Similar with collectd, statsd is a lightweight statics gathering daemon that can be used to collect arbitrary statistics.However statsd flushes stats to Graphite in sync with Graphite's configured write interval. To do this, it aggregates all of the data between flush intervals and created single points for each statistic to send to Graphite. It has many libraries written in different programming languages that make it trivial to build in stats tracking with service or applications.
Install and Configure statsd
https://www.digitalocean.com/community/tutorials/how-to-configure-statsd-to-collect-arbitrary-stats-for-graphite-on-ubuntu-14-04Statsd configure relative with port and interval.
# cat /opt/statsd/localConfig.js
{
graphitePort: 2003 ,
graphiteHost: "0.0.0.0" ,
port: 8125 ,
backends: [ "./backends/graphite" ] ,
graphite: { legacyNamespace: false ,
globalPrefix: "statsd" ,
prefixCounter: "" ,
prefixTimer: "" ,
prefixGauge: "" ,
prefixSet: "" }
}
Thus you should be able to use cli to send the graphite but via statsd via UDP with 8125 port. And as you can see the db schema in configuration files, which means 10 seconds interval for each plot.
[default_1min_for_90day]
pattern = .*retentions = 10s:7d,60s:30d,10m:3y
pattern = .*retentions = 10s:7d,60s:30d,10m:3y
Statsd testing via nc
#echo "metric_name:metric_value|type_specification" | nc -u -w0- #127.0.0.1 8125 #cli eg:$ echo "johnny.gauge:14|g" | nc -u -w0
- #10.xx.xx.xx.xx 8125$ echo "johnny.gauge:15|g" | nc -u -w0
- #10.xx.xx.xx 8125 Check via graphite render api on browser
- #Output e.g.:
- [{"target": "statsd.johnny.gauge", "datapoints": [[14.0, 1443800030], [14.0, 1443800040], [14.0, 1443800050], [15.0, 1443800060], [15.0, 1443800070], [15.0, 1443800080]]}]

PS: Render API
The Carbon process interacts with the Whisper database library to store the time-series data to the filesystem. Using render API can be a very handy tools to verify grpahite data and make sure the data you inject is properly or not.
Python statsd lib
Now, I am showing the coding part !
Install python-pip
#sudo apt-get install python-pip
Install python-statsd library
#sudo pip install python-statsd
root@graphite:~# apt-get install python-pip
Reading package lists... Done
Building dependency tree
Reading state information... Done
python-pip is already the newest version.
0 upgraded, 0 newly installed, 0 to remove and 95 not upgraded.
root@graphite:~# pip install python-statsd
You are using pip version 7.1.0, however version 7.1.2 is available.
You should consider upgrading via the 'pip install --upgrade pip' command.
Collecting python-statsd
/usr/local/lib/python2.7/dist-packages/pip/_vendor/requests/packages/urllib3/util/ssl_.py:90: InsecurePlatformWarning: A true SSLContext object is not available. This prevents urllib3 from configuring SSL appropriately and may cause certain SSL connections to fail. For more information, see https://urllib3.readthedocs.org/en/latest/security.html#insecureplatformwarning.
InsecurePlatformWarning
Downloading python-statsd-1.7.2.tar.gz
Installing collected packages: python-statsd
Running setup.py install for python-statsd
Successfully installed python-statsd-1.7.2
From Graphite Local
root@graphite:~# python
Python 2.7.6 (default, Jun 22 2015, 17:58:13)
[GCC 4.8.2] on linux2
Type "help", "copyright", "credits" or "license" for more information.
>>> import statsd
>>> gauge = statsd.Gauge('johnny')
>>> gauge.send('gauge', 16)
True
The easiest way to install statsd is with pip! You can install from
# pip install statsd
Or GitHub:
# pip install -e git+https://github.com/jsocol/pystatsd#egg=statsd
Or from source:
# git clone https://github.com/jsocol/pystatsd
# cd statsd
# python setup.py install
#python
Reference python statsd library
#import statsd
Send Gauge from 15 to 16
#gauge = statsd.Gauge('johnny')
#gauge.send('gauge', 16)
Then you can check your result in browser.Check via graphite render api on browser url
http://10.xx.xx.xx/render?target=statsd.johnny.gauge&from=-60s&until=-10s&format=json
[{"target": "statsd.johnny.gauge", "datapoints": [[15.0, 1443803470], [15.0, 1443803480], [16.0, 1443803490], [16.0, 1443803500], [16.0, 1443803510]]}]
Other than cli, you can use IDE for editing and easier from syntax check.
Installation in Linux
Install python-pip
#sudo apt-get install python-pip
Install python-statsd library
#sudo pip install python-statsd
Unit Test Demo in Linux
root@graphite:~# apt-get install python-pip
Reading package lists... Done
Building dependency tree
Reading state information... Done
python-pip is already the newest version.
0 upgraded, 0 newly installed, 0 to remove and 95 not upgraded.
root@graphite:~# pip install python-statsd
You are using pip version 7.1.0, however version 7.1.2 is available.
You should consider upgrading via the 'pip install --upgrade pip' command.
Collecting python-statsd
/usr/local/lib/python2.7/dist-packages/pip/_vendor/requests/packages/urllib3/util/ssl_.py:90: InsecurePlatformWarning: A true SSLContext object is not available. This prevents urllib3 from configuring SSL appropriately and may cause certain SSL connections to fail. For more information, see https://urllib3.readthedocs.org/en/latest/security.html#insecureplatformwarning.
InsecurePlatformWarning
Downloading python-statsd-1.7.2.tar.gz
Installing collected packages: python-statsd
Running setup.py install for python-statsd
Successfully installed python-statsd-1.7.2
From Graphite Local
root@graphite:~# python
Python 2.7.6 (default, Jun 22 2015, 17:58:13)
[GCC 4.8.2] on linux2
Type "help", "copyright", "credits" or "license" for more information.
>>> import statsd
>>> gauge = statsd.Gauge('johnny')
>>> gauge.send('gauge', 16)
True
Installation in Mac OS X
The easiest way to install statsd is with pip! You can install from
# pip install statsd
Or GitHub:
# pip install -e git+https://github.com/jsocol/pystatsd#egg=statsd
Or from source:
# git clone https://github.com/jsocol/pystatsd
# cd statsd
# python setup.py install
Unit Test Demo
Hook python session#python
Reference python statsd library
#import statsd
Send Gauge from 15 to 16
#gauge = statsd.Gauge('johnny')
#gauge.send('gauge', 16)
Then you can check your result in browser.Check via graphite render api on browser url
http://10.xx.xx.xx/render?target=statsd.johnny.gauge&from=-60s&until=-10s&format=json
[{"target": "statsd.johnny.gauge", "datapoints": [[15.0, 1443803470], [15.0, 1443803480], [16.0, 1443803490], [16.0, 1443803500], [16.0, 1443803510]]}]
Other than cli, you can use IDE for editing and easier from syntax check.
Using IDE like eclipse
Simple Example
eg: collectD
def grphite_vol_R_IOPs(volno, msg):
CARBON_SERVER = '10.xx.xx.xx'
CARBON_PORT = 2003
#python 3 needs to use bite string instead of using string
message = 'test.test_Volumes.vol%d.readIOPs %d %d\n' % (int(volno), int(msg), int(time.time()+2))
print('sending message:%s' % message)
sock = socket.socket()
sock.connect((CARBON_SERVER, CARBON_PORT))
sock.sendall(message.encode())
sock.close()
volno=0
msg=0
eg: StatsD
Simple Example
#!/usr/bin/python
'''
Created on Oct 2, 2015
@author: johnnywa
'''
import statsd
if __name__ == '__main__':
graphite_svr='10.114.192.154'
graphite_svr_port=8125
statsd_prefix='johnny'
statsd_stat='gauge'
test_statsd=statsd.StatsClient(graphite_svr,
graphite_svr_port,
prefix=statsd_prefix)
test_statsd.gauge(statsd_stat, 17)
Complete example
import statsd
import time
if __name__ == '__main__':
#http://statsd.readthedocs.org/en/latest/reference.html
graphite_svr='10.xx.xx.xx'
graphite_svr_port=8125
statsd_prefix='johnny'
statsd_stat='johnny.test'
test_statsd = statsd.StatsClient(graphite_svr, graphite_svr_port, prefix=statsd_prefix)
#counter // increase or decrease counter, each time by 1 or by value
test_statsd.incr(statsd_stat)
#Timer track how long something took
test_statsd.timing(statsd_stat, 320) # Record a 320ms 'stats.timed'.
#gauges, Gauges are a constant data type. it won't change until you change it and it's flat line
test_statsd.gauge(statsd_stat, 70) # Set the 'foo' gauge to 70.
time.sleep(5)
test_statsd.gauge(statsd_stat, 1, delta=True) # Set 'foo' to 71.
time.sleep(5)
test_statsd.gauge(statsd_stat, -3, delta=True) # Set 'foo' to 68.
time.sleep(5)
#set, Sets count the number of unique values passed to a key.
#For example, you could count the number of users accessing your system using:
userid='johnnywa'
test_statsd.set('users', userid)
pipe = test_statsd.pipeline()
pipe.incr('johnny.incr')
pipe.decr('johnny.decr')
pipe.timing('johnny.timing', 520)
pipe.send()
print "done"
PS: How to delete whisper database.
deleteIdleStats to true so that statsd does not write stats when they are not received. The downfall of deleteIdleStats is that Graphite may now have null values for certain stats. This can be handled on the visualization layer (I recommend Grafana).
Simply restart statsd with #service statsd restart or
update statsd settings to not send stats to backend if the stats are not received AND then #service statsd restart
To delete "whisper" files that you don't need anymore:
#e.g.:
root@graphite:/opt/statsd# cat localConfig.js
{
graphitePort: 2003 ,
graphiteHost: "0.0.0.0" ,
port: 8125 ,
backends: [ "./backends/graphite" ] ,
deleteIdleStats: false ,
graphite: { legacyNamespace: false ,
globalPrefix: "statsd" ,
prefixCounter: "" ,
prefixTimer: "" ,
prefixGauge: "" ,
prefixSet: "" }
}
root@graphite:/var/lib/graphite/whisper/statsd# rm -rf johnny/
root@graphite:/var/lib/graphite/whisper/statsd# rm -rf statsd/
root@graphite:/var/lib/graphite/whisper/statsd# rm -rf test/
root@graphite:/opt/statsd# vi localConfig.js
root@graphite:/opt/statsd# service statsd restart
statsd stop/waiting
statsd start/running, process 5469
Logstash:
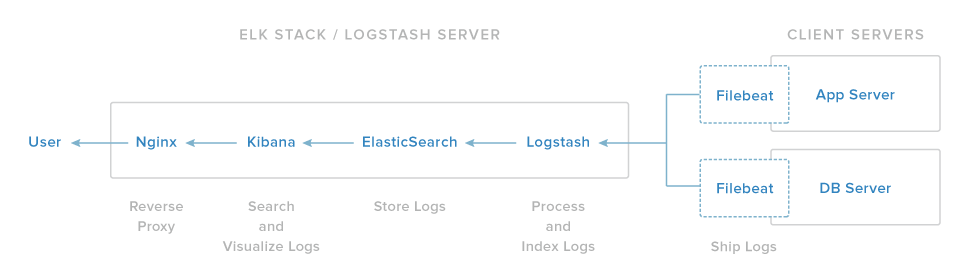
Logstash is a tool sets allow centralized logging for attempting to identify problems with server, application or services, as it allows you to search through all of the logs in single place. It's alos useful because it allows you to identify issues that span multiple servers by correlating their logs during a specific time frame.
PS: logs can be any type, in the example as below we use syslog as example but in reality you can collect any kinds of the log type.
Logstash / Kibana setup has four main components.
- Elasticsearch: Stores all of the logs
- Kibana: Web interface for searching and visualizing logs, which will be proxied through Nginx
- Because we configured Kibana to listen on localhost, we must setup a reverse proxy to allow external access to it. Here we will use Nginx for this purpose.
- Logstash: The server component of Logstash that processes incoming logs
- Logstash Forwarder: Installed on servers that will send their logs to Logstash, Logstash Forwarder serves as a log forwarding agent that utilizes the lumberjack networking protocol to communicate with Logstash
Install and Configure Logstash on Ubuntu 14.04
PS: log bridge server for logforwarder to logstash
Sometimes, the the application server or service node can't be installed logstash forwarder, we need to forward the log to a bridge server as a transfer node and send and send the log from bridge node.
logic:
configure to bridge syslogo server --> using logstash-forwarder --> logstash server
configure to bridge syslogo server --> using logstash-forwarder --> logstash server
Configure Rsyslog to get the log
Configure Rsyslog to forward the log
On bridge server
- Configure application api server to map log to bridge server
- Install logstash forwarder forward the log from bridge server to logstash server
- Cert for logstash server: /etc/pki/tls/certs /logstash-forwarder.crt
- vi /etc/logstash-forwarder.conf
- service logstash-forwarder restart
#e.g.:
root@bridge:/var/log/application# cd /etc/pki/tls/certs
root@bridge:/etc/pki/tls/certs# ls -lart
total 12
drwxr-xr-x 3 root root 4096 Sep 28 18:52 ..
-rw-r--r-- 1 root root 1249 Sep 28 18:53 logstash-forwarder.crt
drwxr-xr-x 2 root root 4096 Sep 28 18:53 .
root@bridge:/etc/pki/tls/certs# cat /etc/logstash-forwarder.conf
{
"network": {
"servers": [ "10.xx.xx.xx.xx:5000" ],
"timeout": 15,
"ssl ca": "/etc/pki/tls/certs/logstash-forwarder.crt"
},
"files": [
{
"paths": [
"/var/log/test-master.info"
],
"fields": { "type": "test-master.info" },
"paths": [
"/var/log/test-master.error"
],
"fields": { "type": "test-master.error" },
"paths": [
"/var/log/test-slice.info"
],
"fields": { "type": "test-slice.info" },
"paths": [
"/var/log/test-slice.error"
],
"fields": { "type": "test-slice.error" },
"paths": [
"/var/log/test-config.info"
],
"fields": { "type": "test-config.info" },
"paths": [
"/var/log/test-config.error"
],
"fields": { "type": "test-config.error" },
"paths": [
"/var/log/test-block.info"
],
"fields": { "type": "test-block.info" },
"paths": [
"/var/log/test-block.error"
],
"fields": { "type": "test-block.error" },
"paths": [
"/var/log/test-collector.log"
],
"fields": { "type": "test-collector.log" },
"paths": [
"/var/log/syslog"
],
"fields": { "type": "syslog" }
}
]
}
Nagios:
Nagios is a very popular open source monitoring system which allows to monitor host resource via web interface. It can also be utilized the NSCA(Nagios Service Check Acceptor) or NRPE (NAgios Remote Plugin Executor) to support variety kinds of purposes. It's useful for keeping an inventory of your servers, and making sure your critical services are up and running.
Nagios Client - NSCA
Nagios leverage LAMP ( Linux, Aapche, MySQL and PHP ) stack on Ubuntu 14.04. and all kinds of plugin.
Nagios Installation on Ubuntu 14.04
LAST: Integration
Last, I would like to follow up with integration with these three tools and summarize the monitoring indicator in Nagios.
- Integration
- Graphite Threshold to trigger Nagios Alert
- Logstash Filter to trigger Nagios Alert
Integration
Nagios check Graphite threshold
For checking Graphite threshold to trigger the Nagios Alert, you might need a plug-in for your application or system. The output nagios flag need to be control within 0=normal, 1=warning and 2=critical.
You can find the nagios graphite plugin here. (Nagios's Graphite Plugin Python download:)
Then you can put the plugin under this directory. (Plugin Directory)
- /usr/lib64/nagios/plugins/
- /usr/local/nagios/libexec/
Unit Test via render api and nagios's graphite plugin, -w = warning threshold, -C = critical threshold.
# python check_graphite_data.py -u "http://10.xx.xx.xx/render?from=-20s&until-10s&until=now&target=statsd.johnny.gauge" -w 13 -c 14Current value: 15.0, warn threshold: 13.0, crit threshold: 14.0
After unit test, you can add the Nagios's configuration file
e.g. test.cfg for configure the Graphite threshold Alert. Here is the template for the Nagios configuration:
e.g. test.cfg for configure the Graphite threshold Alert. Here is the template for the Nagios configuration:
define service{ use generic-service service_description <nagios_service_name> hostgroup_name <group name from ccs-data> check_command check_graphite_data!<graphite query>!<W>!<C> }where:
- <nagios_service_name>: Name of your choosing for the Nagios Service name
- <role name from ccs-data>: The name of the role assigned to this server in ccs-data (see the “ccs-data” section of the “Technical Requirements” document for more details)
- <graphite query>: The Graphite query you want to use to trigger the alert
- <W>: Warning threshold
- <C>: Critical threshold
Nagios Configuration for Graphite Example
#e.g.:
define command {
command_name
check_graphite command_line $USER32$/check_graphite -u https://graphite.example.com -m "$ARG1$" -w $ARG2$ -c $ARG3$ 2>&1
}
define service {
define service {
service_description Graphite Carbon Health Check
hostgroup graphite
check_command
check_graphite!carbon.agents.*.committedPoints!350000!300000
}
#e.g.: define command {
command_name check_graphite
command_line $USER64$/check_graphite_data -u http://10.xx.xx.xx -m "$ARG1$" -w $ARG2$ -c $ARG3$ 2>&1
}
define service {
define service {
service_description Graphite Health Check
hostgroup graphite
check_command check_graphite!statsd.johnny.gauge!13!14
}
Polling - Graphite with Nagios reference url
http://obfuscurity.com/2012/05/Polling-Graphite-with-Nagios
Naghios check Logstash keywords.
You can leverage the nsca to trigger the logstash keyword alert to the naghis server. The logic is very straightforward; elasticsearch in logstash log to find the keyword --> leverage the nsca tools sending the nagios alert through the nsca channel.
NSCA
Nagios Service Check Acceptor (or NSCA for short) is an add-on to transmit check results from one system to another. It consists of two modules: the sender (send_nsca) and the receiver (nsca). The data is sent in a secure manner. Despite its name host check results are transmitted as well.

NSCA with Icinga
root@logstash:/usr/sbin# send_nsca
NSCA Client 2.9.1Copyright (c) 2000-2007 Ethan Galstad (www.nagios.org)Last Modified: 01-27-2012License: GPL v2Encryption Routines: AVAILABLE
Usage: send_nsca -H <host_address> [-p port] [-to to_sec] [-d delim] [-c config_file]
Options:
<host_address> = The IP address of the host running the NSCA daemon
[port] = The port on which the daemon is running - default is 5667
[to_sec] = Number of seconds before connection attempt times out. (default timeout is 10 seconds)
[delim] = Delimiter to use when parsing input (defaults to a tab)
[config_file] = Name of config file to use
Note:This utility is used to send passive check results to the NSCA daemon.
Host and Service check data that is to be sent to the NSCA daemon is read from standard input.
Input should be provided in the following format (tab-delimited unless overriden with -d command line argument, one entry per line):
Service Checks:<host_name>[tab]<svc_description>[tab]<return_code>[tab]<plugin_output>[newline]
Host Checks:<host_name>[tab]<return_code>[tab]<plugin_output>[newline]
When submitting multiple simultaneous results, separate each set with the ETBcharacter (^W or 0x17)
Unit Test NSCA for Logstash Nagios Alert
#e.g.:/bin/echo -e "test-logstash\tlog_threshold_c\t2\tTEST Alert from Johnny Wang\n" | /usr/sbin/send_nsca -H 10.xx.xx.xx(nagios server) -c /etc/send_nsca.cfg
Logstash Configuration for Nagios Alert
Filter Path
[root@logstash conf.d]# pwd/etc/logstash/conf.d
Filter in logstash configuration file folder
[root@logstash conf.d]# cat generate_nagios_alerts.conf
filter {
mutate {
gsub => [
"host",
"\..*", ""
]
}
if [type] == "syslog" and [message]
=~ /megasas\: GetRemoteLoggingHosts\/ {
mutate {
add_field => [
"nagios_host", "%{host}" ]
add_field => [
"nagios_service", "hardware_fault" ]
add_field => [
"nagios_annotation", "CRITICAL: The RAID controller in this host
just reset itself. Please consult the DevOps team about whether it should be
replaced. You will have to manually clear this alarm, as called out at the top
of this document: http://km-reference-post/posts?postId=665200050"
]
add_field => [
"nagios_status", "1" ]
}
}
if [audit_message] {
###########################################################################
##
##
To trigger this "immediately" (simulated), on a sa_client
node:
##
service testin stop
##
cd /var/log
##
echo "CRIT : [$(date '+%Y-%m-%dT%H:%H:%S+0000')]
msg=<POLICY [ReadOnly] --------TS>, path=</etc/libvirt/qemu>,
size_old=<77>, size_new=<49>,
ctime_old=<[2015-06-22T22:00:25]>, ctime_new=<[$(date
'+%Y-%m-%dT%H:%H:%S+0000')]>, mtime_old=<[2015-06-23T22:00:25]>,
mtime_new=<[$(date '+%Y-%m-%dT%H:%H:%S+0000')]>,"
>>testin_log
##
##
It may take 10-ish seconds to come through Logstash.
##
Remove the junk lines that you echo'd into testin_log when you are
done.
##
Don't forget service testin start!
##
###########################################################################
if [audit_message] == "POLICY
[ReadOnly] --------T-" or [audit_path] == "/etc" or [audit_path]
=~ /^\/etc\/libvirt\/qemu\// {
drop { }
}
mutate {
add_field => [
"nagios_host", "%{host}" ]
add_field => [
"nagios_service", "system_change_audit" ]
add_field => [
"nagios_annotation", '"System Change Detected: %{audit_message}
- Path: %{audit_path} "']
add_field => [
"nagios_status", "2" ]
}
}
}
output {
if [nagios_status] == "1" and
[type] != "nagios" {
if [audit_message] {
file {
path =>
"/var/log/system_change_audit-%{+YYYY-MM-dd}.log"
message_format =>
"%{@timestamp} - %{host}: - Audit Policy: %{audit_message} - Path:
%{audit_path}"
}
}
nagios_nsca {
host =>
"nagios.server.com"
port => 5667
nagios_status => "%{nagios_status}"
nagios_host => "%{nagios_host}"
nagios_service => "%{nagios_service}"
send_nsca_config =>
"/etc/nagios/send_nsca.cfg"
send_nsca_bin => "/usr/sbin/send_nsca"
message_format => "%{nagios_annotation}"
}
}
if [nagios_status] == "0" and
[type] != "nagios" {
nagios_nsca {
host =>
"nagios.server.com"
port => 5667
nagios_status => "%{nagios_status}"
nagios_host => "%{nagios_host}"
nagios_service => "%{nagios_service}"
send_nsca_config =>
"/etc/nagios/send_nsca.cfg"
send_nsca_bin => "/usr/sbin/send_nsca"
message_format => "%{nagios_annotation}"
}
}
}
Last: Share Linux Performance Observability Tools
Last: Share Linux Performance Observability Tools

You can learn facts and you can train skills, but "passion is something that has to be felt by the heart." - (The School of Rock), 2003