Saturday, July 15, 2017

How to become MIS for your house : Setup Home Wireless - 1 - Firewall Appliance ( pfSense ) + PoE Switch + Access Points x 2 + IPAM

In series of this post "How to become MIS for your house", I will introduce how to make your home internet as enterprise level. I know most of people will think "This is non-sense and waste time to do this at home !!!". However, this is great journey and allow you to familiar with general MIS works in a company and gain experience for you resume.

Since this is actually part of my job, thus I did give it a try and document everything in my blog. Feel free to try and share your thought with me if you like.


Here are the postings will be included in the topic of "How to become MIS for your house" and I will update them from time to time as long as it is available from my note.


  • Setup Home Wireless - 1: Firewall Appliance ( pfSense ) + PoE Switch + Access Points x 2 and IPAM
  • Providing storage volumes and Share data at home - 2: Setup Samba for sharing videos, music and data and install, configure FreeNAS.
  • More Network Services - 3: DNS, Revere Proxy and VPN to allow connect from outside to your home private LAN.

This post, we will focus on how to setup a general home wireless services. In my case, since my hose has two floors and Wireless access points have to be two and separate on each floor to allow to provide strong wireless signal. If your house have two or multiple floors, this post is great fit for you.

Here is my required gears list to set up my home internet. The total cost is around 600USD.
  1. Internet Service from ISP (Internet Service Provider)
    1. I got Comcast Business Cable Internet Service which is more stable then regular home internet service. https://business.comcast.com/internet/business-internet
  2. Cable Modem:
    1. https://www.amazon.com/gp/product/B00YUU5628/ref=oh_aui_detailpage_o04_s00?ie=UTF8&th=1
  3. Firewall Appliance
    1. https://www.amazon.com/gp/product/B01GIVQI3M/ref=oh_aui_detailpage_o08_s01?ie=UTF8&psc=1
    2. 64GB SATA SSD for Firewall OS - pfSense https://www.amazon.com/gp/product/B00K67E5DA/ref=oh_aui_detailpage_o08_s00?ie=UTF8&psc=1
    3. Another Option is adopted Ubiquiti product family which you will enjoy the easy setup and Ubiquiti software integration, however it's expensive gear in old day but now this firewll appliance is cheaper than Protectli (Firewall Micro Appliance). https://www.amazon.com/gp/product/B00LV8YZLK/ref=oh_aui_detailpage_o01_s01?ie=UTF8&psc=1
  4. PoE Switch 
    1. https://www.amazon.com/gp/product/B00M1C03U2/ref=oh_aui_detailpage_o09_s01?ie=UTF8&psc=1
    2. Ubiquiti production family ( it is more expensive than regular brands ): https://www.amazon.com/gp/product/B00OJZUQ24/ref=oh_aui_detailpage_o01_s00?ie=UTF8&psc=1
  5. Wireless Access Points
    1. https://www.amazon.com/gp/product/B015PRO512/ref=oh_aui_detailpage_o09_s00?ie=UTF8&psc=1
  6. Ethernet Cables - Depends on the distance between your PoE switch to your Wireless Access Point location
    1. https://www.amazon.com/Mediabridge-Ethernet-Cable-Feet-Networking/dp/B001W26TIW/ref=lp_464398_1_1?s=pc&ie=UTF8&qid=1500147425&sr=1-1
  7. Option: I Haven't try this Security UniFi Controller which allow you to operate your LAN setting from remote which is very interesting however I haven't test the compatibility with Non-Ubiquiti gear. https://www.amazon.com/gp/product/B07BB4RGQD/ref=oh_aui_detailpage_o01_s02?ie=UTF8&psc=1
Before I start, I actually architect it and took some of advice from my coworker. The architecture design is as below.

Home Internet Design and Archtecture

As you can see above architecture diagram, the process will be as below.

1. Make sure your ISP connect your cable modem and let internet service up and running - you can see above I am using Comcast Business ISP and connect to Motorola Cable Model on above diagram left top corner.

2. Setup Firewall Appliance - https://doc.pfsense.org/index.php/Installing_pfSense has steps from a to e.

a. Before that you need to prepare Monitor, Keyboard and a USB thumb drive and download pfSense iso file from and prepare a installation media: https://www.pfsense.org/download/
Prepare Installation Media: The downloaded image must be written to target media before it can be used. For a Full Install, this media is used to boot and install and then will not be needed again. For Embedded, the target media is the disk (CF/SD) that will contain the Operating System.

  • Write the installer ISO: If the .iso file was downloaded, it must be burned to a disc as an ISO image. See Writing ISO Images for assistance.
  • Writing Memstick or NanoBSD images: This task is covered with great detail in the Writing Disk Images article here on the wiki.
b. Then you need to open the Firewall Appliance and insert SSD. There has two SSD slots, you need to make sure you insert the top one for pfSense OS. Or you can just buy a full box from Amazon (https://www.amazon.com/Firewall-Micro-Appliance-Gigabit-Intel/dp/B01JHJGG5M/ref=pd_sim_147_2?_encoding=UTF8&psc=1&refRID=6Q1N2KA9SMTEXCTE7Z2Q) and skip SSD installation part. But as you can see Micro Appliance with SSD mSATA is expensive than separated purchase.
Performing a Full Install (ISO, Memstick) Power on the target system and connect the install media: Place the CD into the drive or plug the Memstick into a USB port. If the BIOS is set to boot from CD/USB, pfSense will start. For other boot issues, Installation Troubleshooting. As the operating system boots and pfSense starts, a prompt is presented with some choices and a countdown timer. At this prompt, press i to invoke the installer now.

Installer 01 launch early.png

Alternately, allow the system to boot the rest of the way, assign interfaces, and then choose option 99 to invoke the installer.
The Quick/Easy Install option is, as the name implies, both Quick and Easy. That is the method which will be demonstrated here.
First, the installer console can be changed to use a different font, screenmap, or keymap. Most people do not need to change these, but it may help with some international keyboards.
Installer 02 set console options.png
At the Select Task prompt, choose Quick/Easy Install.
Installer 03 choose task.png
The Quick/Easy Install option assumes the first located disk is the intended target, so be sure there is only one SSD/HDD is present in the system.
NOTE: A GEOM mirror (software RAID) may also be configured by choosing Custom Install and then invoking the option to create the mirror and select the disks. Once that has been completed, then it is possible to return to the Select Task screen and proceed with a Quick/Easy Install
Because the next step is destructive to whatever is currently on the target disk, confirmation is required to proceed. Select OK then press Enter.
Installer 04 easy install confirm.png
The install will proceed, wiping the target disk and installing pfSense. Copying files may take some time to finish.
After the files have been copied to the target disk, a choice is presented to select the console type. Standard defaults to the VGA console. Embedded defaults to serial console.
Installer 05 select console.png
Now the system must reboot so that pfSense may start from the target disk. Select Reboot and then press Enter. Be sure to remove the disc or USB memstick so that the system will not attempt to boot from there next time.
Installer 06 reboot.png Installer 07 rebooting.png
After the system reboots, pfSense will be running from the target disk. The next step is to Assign Interfaces on the Console below. 

c. Post-Install Tasks

After installation and assignment, a shell menu is presented on the console with a number of options. pfSense now is ready to be accessed via the network, either on the LAN interface (if one is assigned), or on the WAN interface in a single interface deployment.
Installer 08 consolemenu.png

d. Assign Interfaces on the Console

The default configuration file on pfSense 2.3 has em0 assigned as WAN, and em1 assigned as LAN. If the target hardware has em0 and em1, then the assignment prompt is skipped and the install will proceed as usual. Several other common platforms such as our SG systems, APU, and ALIX are also recognized and will have their interfaces assigned in the expected order.
If the hardware platform cannot be identified, a list of network interfaces and their MAC addresses that were located on the system will appear, along with an indication of their link state if that is supported by the network card. The link state is denoted by "(up)" appearing after the MAC address if a link is detected on that interface. The MAC (Media Access Control) address of a network card is a unique identifier assigned to each card, and no two network cards should have the same MAC address. After that, a prompt will be shown for VLAN configuration.

e. login into Web GUI
Open a web browser and navigate to https://192.168.1.1 using the default username admin and password pfsense to login.


The first visit to the WebGUI will be redirected to the setup wizard, which is also accessible at System > Setup Wizard. Proceed through the wizard and configure things as desired.
3. After you setup Firewall Appliance, then connect Ethernet Cable from Firewall Appliance to PoE Switch. The model we bought you don't need to configure, however if you bought commercial one which might need extra configuration.

4. Moroever, connect Ethernet Cable to your Wireless Access Points through PoE port (It might be high light in yellow on Switch in my case.) Here has the detail about how to set it up https://dl.ubnt.com/guides/UniFi/UniFi_AP-AC-Pro_QSG.pdf

a. Install Software : Since I bought Ubiquiti Network Access Point, Ubiquiti provides a piece of software to allow you monitor your wireless call UniFi Controller. Here is the example, as you can see there has AP(Access Points) in Upstair and Downstair then I know which device and where is accessing my wireless now.
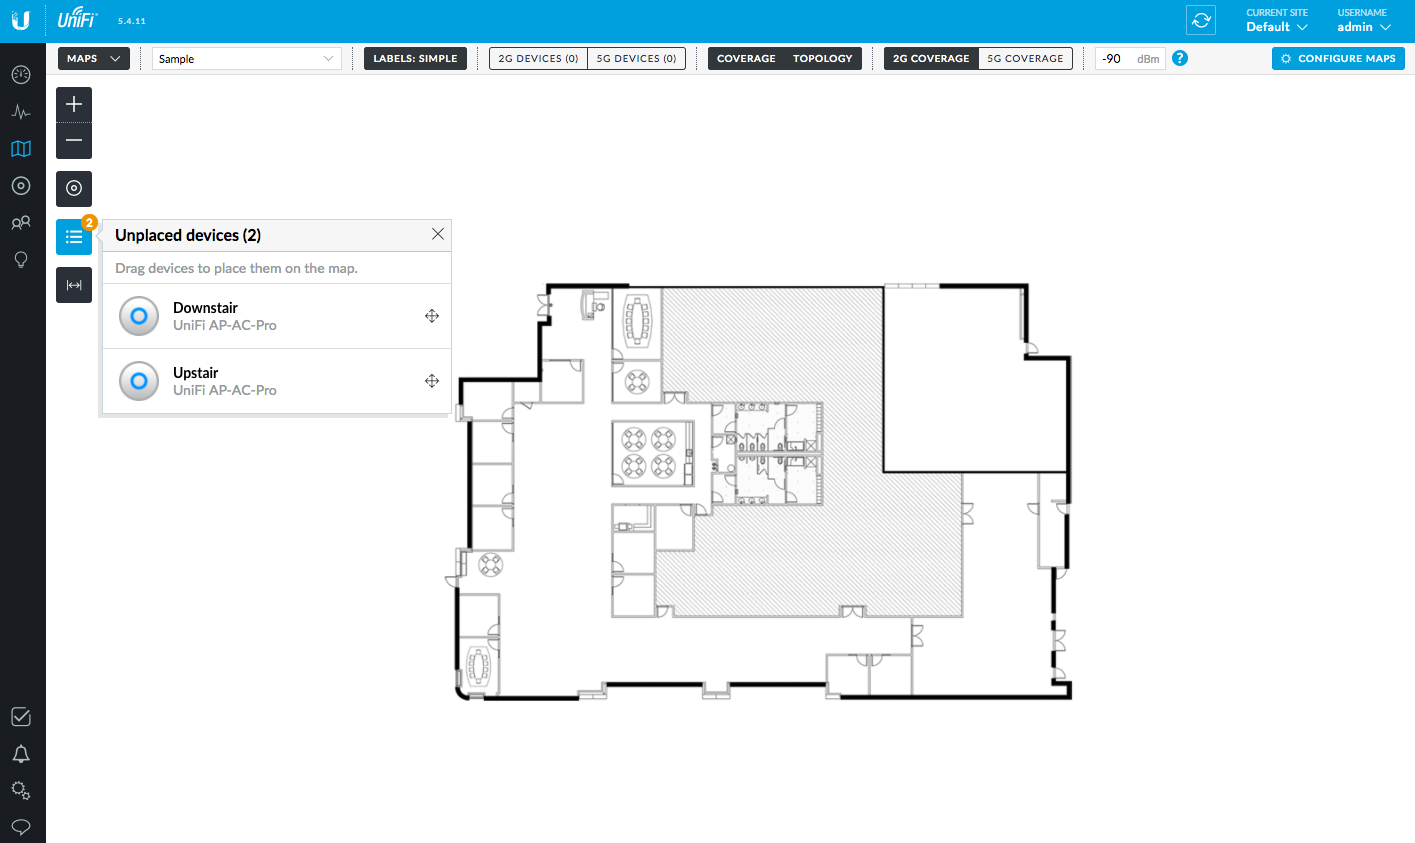


b. Not only the configure your Wireless AP but also monitor all the devices who is access your Wireless AP. The example is as below.


5. Setup IPAM.
For setting up a IPAM to monitor/manage all your IPs (Devices) at home might need a extra machine, it can be a VM or bare metal. I was using Ubuntu 1604 on a workstation.

a. Setup phpIPAM, this post is the best I can find in internet. There has screen shot to walk through you one by one to setup phpIPAM on your box. I think this dude did a great job: https://ithinkvirtual.com/2016/05/08/installing-phpipam-on-ubuntu-16-04/

b. After you setup your IPAM, then try to login to web GUI. such as http://{IP}/phpipam. For adding a new subnet in your house(or company) you need to put such as 192.168.1.0/24 (CIRD-Classless Inter-Domain Routing format) in "Subnet" column.


Then try to scan you subnet to see what IPs in your private Home LAN.

After you give a proper mark and description then you should be see all the IPs has been managed properly in your IPAM. The example is as below fyi.

That it ! You setup cable and wireless AP for your home and manage wireless access devices and some static IPs for your home workstation or servers. So you are almost be a Network Admin for a small scale size company now !!!

Monday, July 10, 2017

How to mount OpenStack Swift as a attached Drive in your OS

For allowing me to mount Swift as a drive in OS, I leverage goofys. It's a great tools to allow you mount an S3 bucket as a file system.

However since goofys works with S3 API only, I have to turn on Swift S3 ( S3 emulation layer ) to make it work.

Moreover, I double check aws golang sdk, the endpoint have to be setup with region and no https.

Thus I setup swiftstack on my local virtualbox non-ssl and it's working for me.

1. ~/.aws/credentail
```
$ cat credentials
[default]
aws_access_key_id = s3
aws_secret_access_key = 52b1fb2e26e97010be092f815db87f26
```


2. $ goofys --endpoint http://ss02.swiftstack.idv/ --region US jwangtest ~/goofys

goofsy --endpoint <your swift endpoint> --region <default is US> <container/bucket> <mount point>

3. drag and drop file and it will sync from your local FUSE drive with swift


PS: I tested on both ends. goofys can sync both ( from swift to local FUSE goofys drive or from local FUSE goofys drive to swift ).

Reference:

Tuesday, May 16, 2017

How to setup Development Environment for Vim and Git view on Mac

Setup Development Environment on Mac OS for Vim and Git 

1. For mac os x
/.bash_profile
if [ -f ~/.prompt ]; then
    . ~/.prompt
fi

2. Enable git prompt
/.prompt
# add git prompt
function parse_git_branch {
    git branch --no-color 2> /dev/null | sed -e '/^[^*]/d' -e 's/* \(.*\)/(\1)/'
}
function proml {
    local    BLUE="\[\033[0;34m\]"
    local   LBLUE="\[\033[1;34m\]"
    local    RED="\[\033[0;31m\]"
    local   LRED="\[\033[1;31m\]"
    local  GREEN="\[\033[0;32m\]"
    local LGREEN="\[\033[1;32m\]"
    local  WHITE="\[\033[1;37m\]"
    local  LGRAY="\[\033[0;37m\]"
    local YELLOW="\[\033[0;33m\]"
    local LYELLOW="\[\033[1;33m\]"
case $TERM in
        xterm*)
            TITLEBAR='\[\033]0;\u@\h:\w\007\]'
            ;; 
        *) 
            TITLEBAR=""
            ;; 
        esac
PS1="${TITLEBAR}\
$LGRAY[$LRED\$(date +%H:%M)$LGRAY]\
$LGRAY[$LYELLOW\u@\h: $LBLUE\w $LGREEN\$(parse_git_branch)$LGRAY]\
$WHITE \$ $LGRAY"
PS2='> '
PS4='+ '
}
proml


3. Setup Vundle:
$ git clone https://github.com/VundleVim/Vundle.vim.git ~/.vim/bundle/Vundle.vim

Ref:
GitHub
VundleVim/Vundle.vim
Vundle.vim - Vundle, the plug-in manager for Vim


4. /.vimrc

```
set nocompatible              " be iMproved, required
filetype off                  " required

" set the runtime path to include Vundle and initialize
set rtp+=~/.vim/bundle/Vundle.vim/
call vundle#begin()

Plugin 'gmarik/Vundle.vim'

Plugin 'Lokaltog/vim-easymotion'
Plugin 'Lokaltog/vim-powerline'
Plugin 'tpope/vim-fugitive'
Plugin 'mileszs/ack.vim'
Plugin 'hrp/EnhancedCommentify'
Plugin 'greyblake/vim-preview'
Plugin 'mattn/emmet-vim'
Plugin 'Valloric/YouCompleteMe'
Plugin 'vim-scripts/indentpython.vim'
Plugin 'nvie/vim-flake8'
Plugin 'scrooloose/syntastic'
Plugin 'fatih/vim-go'

call vundle#end()

set laststatus=2
set t_Co=256
let g:Powline_symbols='fancy'
let python_highlight_all=1

let g:EasyMotion_leader_key=','
let g:go_def_mapping_enabled = 1

filetype plugin indent on

set backspace=2
set sw=4
set ts=4
set et
set hls
set autoindent
set nu
set nofoldenable

au BufNewFile,BufRead *.py
            \ set tabstop=4 |
            \ set softtabstop=4 |
            \ set shiftwidth=4 |
            \ set textwidth=79 |
            \ set expandtab |
            \ set autoindent |
            \ set fileformat=unix

syntax on
syntax enable
match Error /\s\+$/

```

5. Install Vundle

Open vim and : jump to command line then type: VundleInstall


Tip: how to auto correct indent
  1. Type "v"
  2. Up or down select section
  3. Type "="


Wednesday, April 12, 2017

How to write and debug grok pattern in ELK.

elk, it's elastic search, log stash and kibana, three open source key components from elastic search. logstash process the logs, and elastic search provide log indexing, storing ... etc features and kibana displays the result in web UI.

I introduce how to setup elk5 server is my previous post, thus I won't explain the installation and setup but welcome to check previous post before you start it.

If you just start the grok pattern, I recommend you check out the elastic search web site to get some grok pattern basic concept. 

This post, I will show you how to write/debug a grok pattern with different tools and give a proper tags for your log which allow to search , indexing or event prepare for further utilization in the further such as Machine Learning.


0. outline


  1. Preparation
  2. Design
  3. Implementation
    1. Regular Expression - debugging
    2. Grok Pattern
      1. Method 1: online debug tools
        1. First Steps
        2. Second Steps
        3. Third Steps
        4. Last review result
      2. Method 2: Check Logs


1. Preparation


After you finish the installation you should be able to see the folders/files under /etc/logstash/ as below.

$ ls -larth
total 44K
-rw-rw-r--   1 root       root       1.7K Nov 11 14:25 startup.options
-rw-rw-r--   1 root       root       1.7K Nov 11 14:25 jvm.options
-rw-rw-r--   1 root       root       1.4K Feb 24 09:41 log4j2.properties
-rw-rw-r--   1 root       root       2.8K Feb 24 23:56 logstash.yml.dpkg-old
lrwxrwxrwx   1 root       root         86 Feb 25 00:04 patterns -> /usr/share/logstash/vendor/bundle/jruby/1.9/gems/logstash-patterns-core-4.0.2/patterns
-rw-rw-r--   1 root       root       4.4K Mar 13 16:49 logstash.yml
drwxrwxr-x   4 root       root       4.0K Mar 13 17:01 .
drwxr-xr-x 110 root       root       4.0K Apr  5 10:16 ..
drwxrwxr-x   2 swiftstack swiftstack 4.0K Apr 12 17:39 conf.d
drwxr-xr-x   2 swiftstack swiftstack 4.0K Apr 12 18:05 extra_patterns

There are three major folders you might need to be aware.

a. patterns:
As you can see it's a soft link to your logstash installation directory since logstash will bring the native patterns for your to leverage it.

b. extra_patterns:
You can prepare your customized pattern which is regular expressions mapping to leverage in your grok pattern.

c. conf.d:
You will have a grok pattern mapping under this folder. e.g:
$ ls ./conf.d/ -larth
total 48K
-rw-r--r-- 1 swiftstack swiftstack  271 Feb 27 16:18 30-elk5-output.conf
-rw-r--r-- 1 swiftstack swiftstack  409 Feb 27 20:41 10-rsyslog-input.conf
drwxrwxr-x 4 root       root       4.0K Mar 13 17:01 ..
-rw-rw-r-- 1 swiftstack swiftstack  29K Apr 12 17:39 20-rsyslog-filter.conf
drwxrwxr-x 2 swiftstack swiftstack 4.0K Apr 12 17:39 .


2. Design

The design is all depends on you, in my design I will separate input, filter and output into three diff *.conf but you can either put them together or separate each grok patterns into multiple *.conf thus you might have.
e.g input, filter_1, filter_2 ... etc and output.


In my case, I leverage rsyslog to forward the log to logstash, the detail you should be able to find in here.

a. input:
Input.conf is the taking the logs from syslog and identify the format which is json line by lone.

e.g: $ cat 10-rsyslog-input.conf
# This input block will listen on port 10514 for logs to come in.
# host should be an IP on the Logstash server.
# codec => "json" indicates that we expect the lines we're receiving to be in JSON format
# type => "rsyslog" is an optional identifier to help identify messaging streams in the pipeline.

input {
  udp {
    port => 10514
    codec => json_lines
    type => "rsyslog"
  }
}

b. filter
Filter.conf is the key we put the grok patterns. I will emphasis it in later section.

e.g: $ cat 20-rsyslog-filter.conf
# This is an empty filter block.  You can later add other filters here to further process
# your log lines

filter {
################################
# Object Expirer patterns
################################
#
# EXAMPLE LOG ENTRIES
################################
# OBJ_EXP_START Oct 15 13:13:00 localhost.localdomain object-expirer: Pass beginning; 0 possible containers; 0 possible objects
# OBJ_EXP_FINISH Oct 15 13:13:00 localhost.localdomain object-expirer: Pass completed in 0s; 0 objects expired
################################
  if [programname] == "object-expirer" {
    if "beginning" in [message] {
      grok {
        patterns_dir => ["/etc/logstash/patterns", "/etc/logstash/extra_patterns"]
        match => { "message" => " Pass beginning; %{BASE10NUM:PossibleContainers} possible containers; %{BASE10NUM:PossibleObject} possible objects" }
        add_tag => ["swift", "object", "expirer", "OBJ_EXP_START"]
        remove_tag => ["_grokparsefailure"]
        remove_field => ["PossibleContainers", "PossibleObject"]
      }
    }
    else {
      grok {
        match => { "message" => " Pass completed in %{NUMBER:CompletedSeconds}s; %{BASE10NUM:ObjectsExpired} objects expired" }
        remove_tag => ["_grokparsefailure"]
        add_tag => ["swift", "object", "expirer", "OBJ_EXP_FINISH"]
        remove_field => ["CompletedSeconds", "ObjectsExpired"]
      }
    }
  }

c. output
Output.conf is the logs parse in logstash and forward to elasticsearch thus you can see the output is elasticsearch server ( localhost ) and port.

e.g: $ cat 30-elk5-output.conf
# This output block will send all events of type "rsyslog" to elasticsearch at the configured
# host and port into daily indices of the pattern, "rsyslog-YYYY.MM.DD"

output {
  if [type] == "rsyslog" {
    elasticsearch {
      hosts => [ "localhost:9200" ]
    }
  }
}


3. Implement

This section I will show you how to write a grok patter and how to debug it. I was stuggling the grok patter implementation for a while and found these steps / tools do help me a lot.

Let's give an example from your un-parser logs, as you can see most of the data was matched by default logstash but some of them in message wasn't and turns out can't find any pattern and error out via a tag: _grokparsefailure.
{
  "_index": "logstash-2017.04.12",
  "_type": "rsyslog",
  "_id": "AVtkdWQiSkb40H9LtWNZ",
  "_score": null,
  "_source": {
    "severity": "info",
    "@timestamp": "2017-04-12T23:17:46.000Z",
    "@version": "1",
    "programname": "proxy-server",
    "procid": "-",
    "host": "127.0.0.1",
    "sysloghost": "cloud-pac01",
    "message": " Copying object from /v1/AUTH_sme/stepan/Folders_pack/03 with special characters ~`!@#$%^&()_+-={}[];',._over_PHP.zzz to /v1/AUTH_sme/stepan/.trash/org/Folders_pack/03%20with%20special%20characters%20%7E%60%21%40%23%24%25%5E%26%28%29_%2B-%3D%7B%7D%5B%5D%3B%27%2C._over_PHP.zzz (txn: txae6773cb5efd47ae86c1b-0058eeb59a)",
    "type": "rsyslog",
    "facility": "local0",
    "tags": [
      "_grokparsefailure"
    ]
  },
  "fields": {
    "@timestamp": [
      1492039066000
    ]
  },
  "highlight": {
    "message": [
      " @kibana-highlighted-field@Copying@/kibana-highlighted-field@ @kibana-highlighted-field@object@/kibana-highlighted-field@ @kibana-highlighted-field@from@/kibana-highlighted-field@ /v1/AUTH_sme/stepan/Folders_pack/03 with special characters ~`!@#$%^&()_+-={}[];',._over_PHP.zzz to /v1/AUTH_sme/stepan/.trash/org/Folders_pack/03%20with%20special%20characters%20%7E%60%21%40%23%24%25%5E%26%28%29_%2B-%3D%7B%7D%5B%5D%3B%27%2C._over_PHP.zzz (txn: txae6773cb5efd47ae86c1b-0058eeb59a)"
    ]
  },
  "sort": [
    1492039066000
  ]
}


In above message "  Copying object from /v1/AUTH_sme/stepan/Folders_pack/03 with special characters ~`!@#$%^&()_+-={}[];',._over_PHP.zzz to /v1/AUTH_sme/stepan/.trash/org/Folders_pack/03%20with%20special%20characters%20%7E%60%21%40%23%24%25%5E%26%28%29_%2B-%3D%7B%7D%5B%5D%3B%27%2C._over_PHP.zzz (txn: txae6773cb5efd47ae86c1b-0058eeb59a)" is basically a sting to tell us "Copying object from "A" to "B" (txn: TXN)" that it. However, we notice some of the features in below bullet items.

a. there has special characters in messages e.g : "(" and ")", we need to skip it.
b. there has special characters in messages e.g : "...$%^..."
c. there might has foreign letter which need unicode to be includes in our patterns.


3.1 Regular Expression

First of all we need to design a regular expression pattern to map what we want and allow us to re-use it all the time in the later mapping.

Before we start I have to introduce you a easy on line tool to parse your regex ( regular expression ) - https://regex101.com

a. leverage existing pattern - I call it use your own dog food.
# TXN in transaction number
# In OpenStack swift we use it a lot thus I design a extra-pattern to leverage it all the time
# This example is very straight forward just two words concats together.
TXN %{WORD}[-]%{WORD}


# Above a + b + c bullet items can be summarized as below which 
# Copy from unicode object path which allow unicode
#\w matches any word character (equal to [a-zA-Z0-9_])
#\s matches any whitespace character (equal to [\r\n\t\f\v ])
#\/ matches the character / literally (case sensitive)
#\. matches the character . literally (case sensitive)
#\p{L} matches any kind of letter from any language
#\p{N} matches any kind of numeric character in any script
#\p{S} matches any math symbols, currency signs, dingbats, box-drawing characters, etc
#\p{P} matches any kind of punctuation character
COPYFROMUNICODE [\w\s\/\.\p{L}\p{N}\p{S}\p{P}]+

Via online regex tools we can practice and debug our regex which an match the requirement or not.

This tools has detail explination about how regex map to your test string.
/
[\w\s\/\.\p{L}\p{N}\p{S}\p{P}]+
/
Match a single character present in the list below 
[\w\s\/\.\p{L}\p{N}\p{S}\p{P}]+
+ Quantifier — Matches between one and unlimitedtimes, as many times as possible, giving back as needed (greedy)
\w matches any word character (equal to [a-zA-Z0-9_])
\s matches any whitespace character (equal to [\r\n\t\f\v ])
\/ matches the character / literally (case sensitive)
\. matches the character . literally (case sensitive)
\p{L} matches any kind of letter from any language
\p{N} matches any kind of numeric character in any script
\p{S} matches any math symbols, currency signs, dingbats, box-drawing characters, etc
\p{P} matches any kind of punctuation character

This is how you debug the special string. Try this link.

After we sort the pre-define mapping pattern we put them under /etc/logstash/extra_patterns/...

e.g: $ cat ../extra_patterns/swift
# Swift logs documentation: http://docs.openstack.org/developer/swift/logs.html

# TXN in transaction numbers
TXN %{WORD}[-]%{WORD}

# Copy from unicode object path which allow unicode
#\w matches any word character (equal to [a-zA-Z0-9_])
#\s matches any whitespace character (equal to [\r\n\t\f\v ])
#\/ matches the character / literally (case sensitive)
#\. matches the character . literally (case sensitive)
#\p{L} matches any kind of letter from any language
#\p{N} matches any kind of numeric character in any script
#\p{S} matches any math symbols, currency signs, dingbats, box-drawing characters, etc
#\p{P} matches any kind of punctuation character
COPYFROMUNICODE [\w\s\/\.\p{L}\p{N}\p{S}\p{P}]+


3.2 Grok Patterns

After we prepare extra_patterns we can add grok patterns in 2. filter.conf.

Before you start you might now what's the general structure for your filter, thus below is an example for you to reference it. I highlight them into 4 major colors which is easier for you to catch it. In my case if the pattern match, I will give "swift", "proxy" and "PROXY_SER_SIDE_COPY"

e.g: $ cat 20-rsyslog-filter.conf
filter {
################################
# proxy server patterns info
################################
  if [programname] == "proxy-server" and [severity] == "info" {
    if "Copying object from" in [message] and "to" in [message] {
      grok {
        patterns_dir => ["/etc/logstash/patterns", "/etc/logstash/extra_patterns"]
        match => { "message" => " Copying object from %{COPYFROMUNICODE:copy_from_obj_path} to %{NOTSPACE:copy_to_obj_path} \(txn: %{NOTSPACE:txn}\)" }
        remove_tag => ["_grokparsefailure"]
        add_tag => ["swift", "proxy", "PROXY_SER_SIDE_COPY"]
      }
    }
  }
}

However, how do we know the grok pattern is correct, there has two major way to test it. There has some grok pattern on line debugger, here is the example.

Method 1: you can leverage online debug tools. 
First column is your source which is message content in my example log

 Copying object from /v1/AUTH_sme/stepan/Folders_pack/03 with special characters ~`!@#$%^&()_+-={}[];',._over_PHP.zzz to /v1/AUTH_sme/stepan/.trash/org/Folders_pack/03%20with%20special%20characters%20%7E%60%21%40%23%24%25%5E%26%28%29_%2B-%3D%7B%7D%5B%5D%3B%27%2C._over_PHP.zzz (txn: txae6773cb5efd47ae86c1b-0058eeb59a)

Second column is the grok pattern I wrote.

 Copying object from %{COPYFROMUNICODE:copy_from_obj_path} to %{NOTSPACE:copy_to_obj_path} \(txn: %{NOTSPACE:txn}\)

In my case I leverage extra pattern thus I check the "Add custom patterns"
And put my extra pattern in the textbook.

COPYFROMUNICODE [\w\/\.\p{L}\p{N}\p{S}\p{P}\s]+
TXN %{WORD}[-]%{WORD}

Third is adding extra pattern then you can click go

Final, then you should be able to see the result as below.


{
  "copy_from_obj_path": [
    [
      "/v1/AUTH_sme/stepan/Folders_pack/03 with special characters ~`!@#$%^&()_+-={}[];',._over_PHP.zzz"
    ]
  ],
  "copy_to_obj_path": [
    [
      "/v1/AUTH_sme/stepan/.trash/org/Folders_pack/03%20with%20special%20characters%20%7E%60%21%40%23%24%25%5E%26%28%29_%2B-%3D%7B%7D%5B%5D%3B%27%2C._over_PHP.zzz"
    ]
  ],
  "txn": [
    [
      "txae6773cb5efd47ae86c1b-0058eeb59a"
    ]
  ]
}

The whole debug page is as blow.


Method 2: check logstash log to trace the grok pattern bug. 
$ sudo service logstash restart 
then tail the logstash log see whether there has clue for you.
$ sudo tail -f /var/log/logstash/logstash-plain.log

If you are not seeing the error and restart log show success as below. Then you are done !!!
[2017-04-12T18:03:19,124][INFO ][logstash.pipeline        ] Starting pipeline {"id"=>"main", "pipeline.workers"=>2, "pipeline.batch.size"=>125, "pipeline.batch.delay"=>5, "pipeline.max_inflight"=>250}
[2017-04-12T18:03:19,133][INFO ][logstash.pipeline        ] Pipeline main started
[2017-04-12T18:03:19,133][INFO ][logstash.inputs.udp      ] Starting UDP listener {:address=>"0.0.0.0:10514"}
[2017-04-12T18:03:19,150][INFO ][logstash.inputs.udp      ] UDP listener started {:address=>"0.0.0.0:10514", :receive_buffer_bytes=>"106496", :queue_size=>"2000"}
[2017-04-12T18:03:19,188][INFO ][logstash.agent           ] Successfully started Logstash API endpoint {:port=>9600}

That it ! Then you should be able to have correct mapping logs with tags which in my case is "swift", "proxy", "PROXY_SER_SIDE_COPU"


Reference:
https://regex101.com
https://grokdebug.herokuapp.com/
https://www.elastic.co/guide/en/logstash/current/plugins-filters-grok.html
